If you have been using Excel for years, this will feel strange at first.
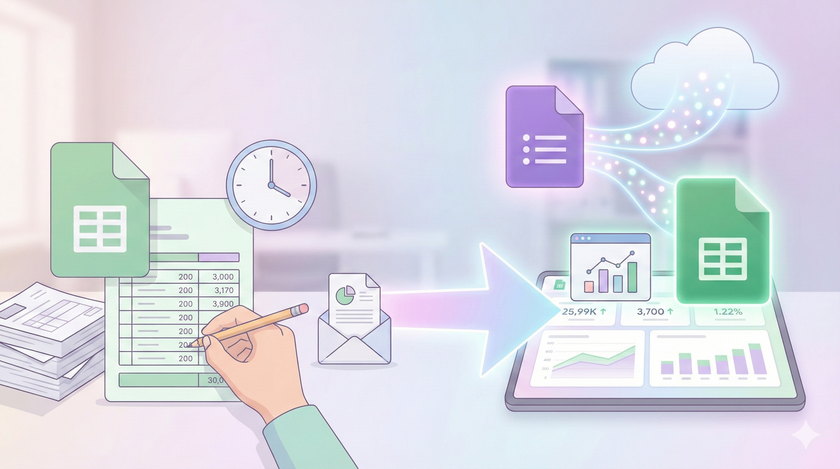
In Excel, you pull data from somewhere. You process it. You create a report. You email it to someone. Next week, you do the same thing again. And again. Every report is manual work.
This is how most businesses operate. The MIS executive spends hours compiling weekly reports. The business owner waits for someone to "prepare" the numbers before a meeting. Data exists in one place, reports exist in another, and a human being is the bridge between them.
But it does not have to be this way.
The shift
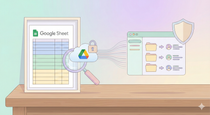
When you collect data through Google Forms, it lands directly in a Google Sheet. You already know this from the previous posts.
Here is what you might not have realized: if you set up your summary formulas once, the report is always current. You do not generate reports. You just look at them.
Let me say that again. You do not generate reports. You just look at them.
The form collects the data. The sheet summarizes it. The summary updates every time someone submits the form. No intervention needed.
What this looks like in practice
Let us say you created a daily sales form. Your sales team fills it after every order. Date, customer name, product, amount. Four fields.
In the same Google Sheet where this data lands, you create another tab called "Summary." In one cell, you write a simple formula:
=SUMIF('Form Responses'!A:A, ">="&DATE(2025,1,1), 'Form Responses'!D:D)
This gives you total sales from January 2025 onwards.
In another cell:
=COUNTIF('Form Responses'!A:A, ">="&TODAY()-7)
This tells you how many orders came in the last 7 days.
You set this up once. After that, every time someone submits the form, these numbers update automatically. You wake up in the morning, open the sheet, and yesterday's sales are already there. No one prepared anything. No one compiled anything. The system did it.
Why this matters
Think about the reports you currently rely on.
How many of them require someone to sit down, pull data from multiple sources, arrange it in a format, and then send it to you? How many hours does this take every week? What happens when that person is on leave?
Now think about what changes when the report updates itself.
The MIS executive stops being a data compiler. They become someone who designs systems and analyzes trends. The business owner stops waiting for reports. They check the numbers whenever they want, knowing the data is current.
This is not about saving time. It is about changing what is possible.
When generating a report takes hours, you generate it weekly. Maybe monthly. You make decisions based on data that is already old.
When the report updates itself, you can check it daily. You spot problems earlier. You catch opportunities faster. The business becomes more responsive because the information flows without friction.
Start with one
Do not try to build a dashboard with 50 metrics. That comes later.
Pick one number that matters to your business. Something you currently track manually or ask someone to compile.
Create a form that captures the raw data. Set up one formula that gives you the summary. Use it for a week.
Once you see it working, you will understand what else is possible.
What you do not need
You do not need to learn programming. The formulas are simple. SUMIF, COUNTIF, AVERAGE. If you have used Excel, you already know these.
You do not need expensive software. Google Sheets is free with your Google account. Google Workspace costs a few hundred rupees per month if you want organizational controls.
You do not need to change everything at once. Your Tally will keep running. Your existing reports will continue. This is an addition, not a replacement.
The real insight
The technology to do this has existed for years. Google Sheets has had these features since the beginning. So why do most businesses still compile reports manually?
Because no one told them it could be different.
You were taught Excel as a tool for processing data. Open file, edit, save, close. The mental model is a document that sits on your computer. You work on it, then you are done.
Google Sheets looks similar, but it works differently. It is not a document. It is a live system. Data flows in. Formulas process it. The output is always current.
Once you understand this, you stop thinking about "making reports" and start thinking about "setting up systems that report automatically."
That is the shift.
Next post: We will look at which formulas actually matter and how to set up your first self-updating summary. No theory. Just the five formulas that cover 90% of what you need.